I’ve been using spaced repetition for quite some time now. My favorite program is Anki, even if I have also tried a few others. I had actually developed one myself before I even knew the SuperMemo algorithm existed back in the late 1990’s, that was more than 10 years before the first Anki release.
Interestingly, spaced repetition has been around since the democratization of computers. That’s for a reason: spaced repetition is very easy to do on computers, but not so easy with physical supports. Although Piotr Wozniak, the inventor of Spaced Repetition, used paper to do his studies, he switched to a computerized version as soon as he got a computer. I have been wondering for a while how it could be achieved without too much hassle from the user’s point of view. I finally came up with what I find a rather easy and elegant solution.
The problem with regular flashcards
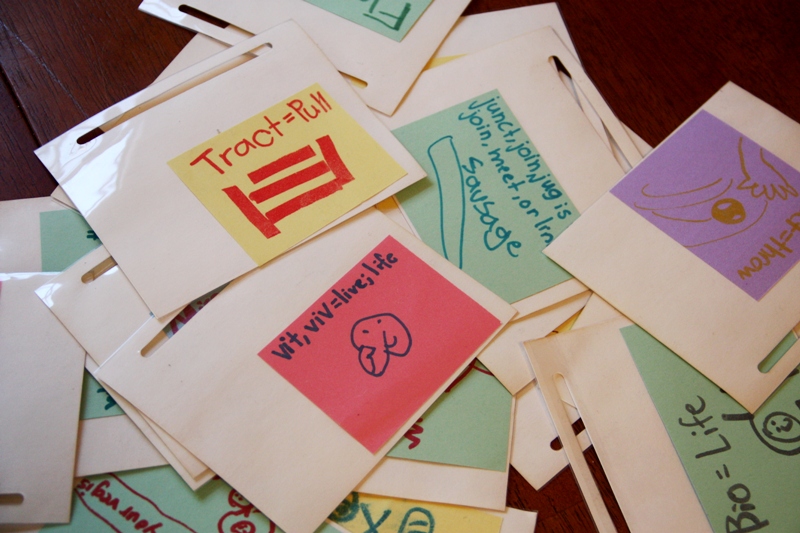
Who didn’t try to make paper cards of things they wanted to remember? You write a question on the front side, the answer on the back side. It could be anything, including pictures. When picking that card, you have to remember the answer. By repeating the process, you’ll learn that information, eventually.
However, without a planned schedule, that process is very inefficient. You often get exposed to cards that you already know perfectly, which is frustrating, especially if there are so many of them. The sensation that you’re losing your time is taking over. Then you’re tempted to put them away for good. Only to realize a few months later that you forgot the information they hold. Similarly, you sometimes get exposed to cards that you have already forgotten.
This is why Spaced Repetition has been invented: it is optimizing the interval at which you are exposed to the different cards.
Spaced Repetition principles
So, just as a reminder, what is Spaced Repetition?
Basically, it is taking advantage of how our memory works. When exposed to some information for the first time, the brain forgets it very fast. It could be just an hour or a day. Then it filters this information out, to give space to new information. But when exposed to this information again before it is wiped out, the brain starts giving some bigger importance to it. Thus it will remember it longer. Maybe 2 or 3 days.
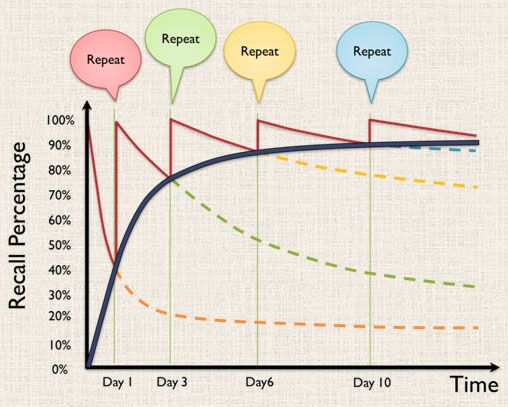
Again, after a few days, that information will be deleted. Unless you get exposed to it again before it is erased, in which case it will get an even stronger importance. This time, the brain will remember it for a week or two. And so on. Basically, every time you remember that information before it gets deleted, the brain sort of doubles its importance. This means that it will take double the time before it forgets it. “Double” is a rough estimate, the actual rate varies from person to person, and heavily depends on the knowledge to be learned itself, along with the eagerness of the learner.
So the goal is to be exposed to the information at increasing intervals. The key being that the information should reappear before it is erased from your memory.
Attempts
There are people who have attempted to do that. Of course, the inventor himself came up with tables where he marks the intervals.

Although it works, it uses up some paper, and you need a cache to cover the words that need to be learned.
Other people have invented something which is closer to my goal. The idea is to have several boxes, each one of them contains a different interval. The first time you’re exposed to a card, you’ll put it in the first box, which is the daily interval. Once it is learned, it goes to the second box, which could be the weekly interval. And so on.
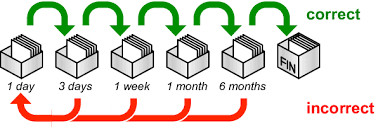 There is still a problem with this method: if you pick cards from the weekly box every Sunday, then you’ll pick cards from Saturday, which is not good.
In other words, the question is: how do you know how many cards to pick from the weekly box and when to pick them? How do you know 7 days have really passed since that card was put in the box? You don’t know. Which can cause problems. Especially when moving to longer intervals.
Thinking of a board
I thought about developing a board on which it would be easy to know when to pick cards, especially on longer intervals.
Just like the boxes, the goal is to have several zones on the board, with increasing intervals. Thus when remembering a card in a certain zone, it is then moving up to the next zone. This way, the intervals for a card are increasing, similar to the boxes.
Furthermore, for a card in a long interval zone, we can add markers to show where we are in the interval. Luckily, it is not difficult to make markers.
Additionally, everything depends on the size of the cards you want. I chose the “compact” route, with cards that are square and not bigger than an inch (actually 2 cm in my prototype). But of course, the same principle could just be used with bigger cards, it would simply take more space.
The final result and its explanations
Here is the model of the board I have come up with, which I then printed with a 3D printer.
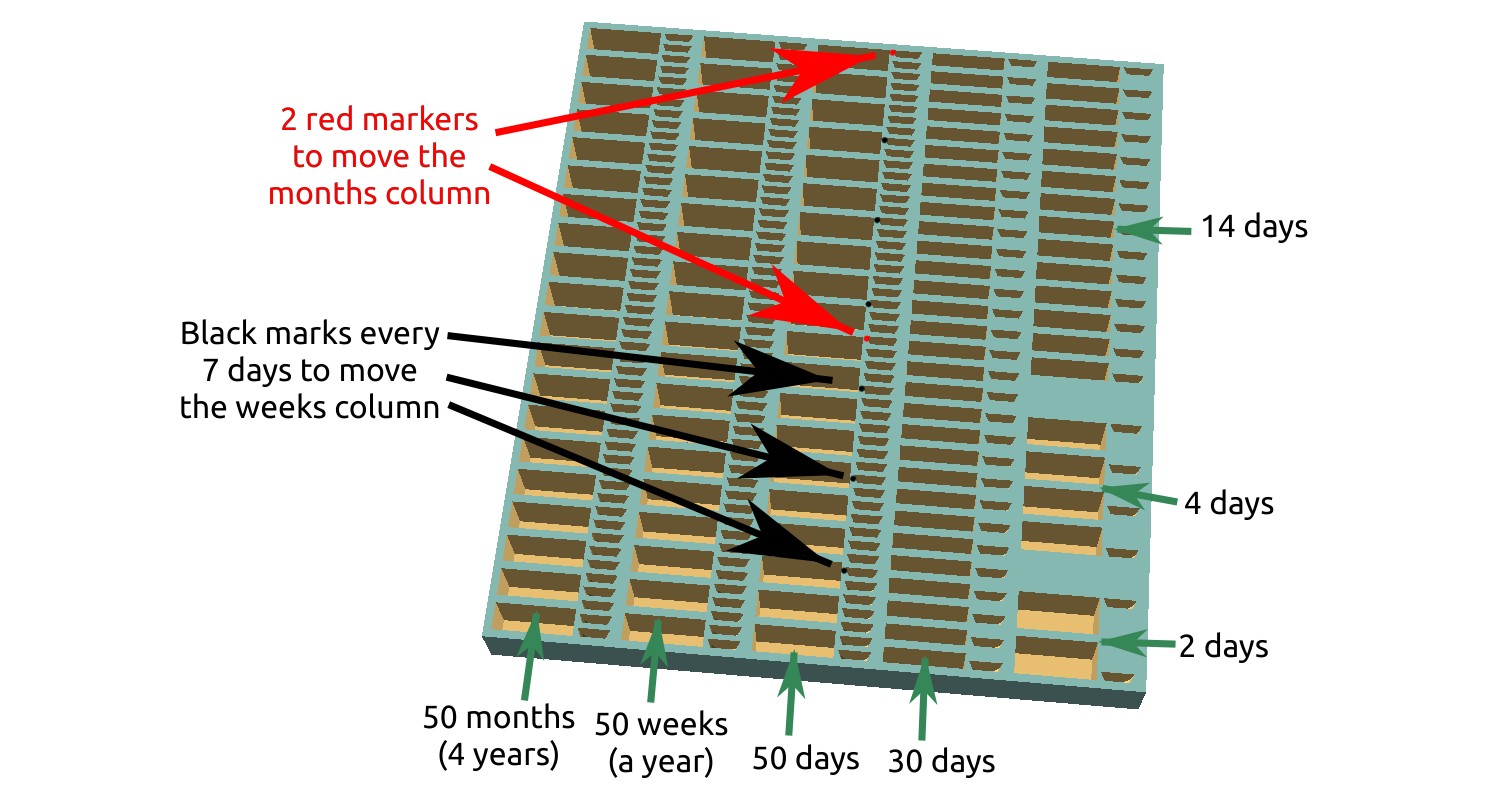
The column on the right represents the shortest intervals. Every column has two parts: the left part with larger holes in which the cards can be kept, and the right part that contains small holes in which little pegs can be inserted. These pegs are the markers that help keep track of where we are in time.
Moving Pegs
Basically, you just move every peg one step further. They show you directly which cards need to be reviewed that day. Here is what happens when you start a new day:
For the longest intervals, the pegs are moved forward only when the last daily peg reaches one of the marked spots, as seen in this picture:

This way, the two last columns move forward only when the “Daily Move” column reaches one marked spot. This happens every week and every month, respectively.
Note that the last 3 columns have more “peg holes” than “card holes”. Therefore, you don’t need to review cards in these three columns right away when the peg comes to a new spot with cards. Instead, you can pick them gradually, for instance on less busy days.
Learning cards
Every day, you pick cards from the spots that are marked by the pegs. If you forgot the contents of the card, then that card goes back to daily learning, at the bottom right of the board.
If you did remember what was on a card, then you can move it to the next zone, just behind the next zone’s marker. This way, you will have to wait a full cycle of the marker to review that card again.
Here is the representation of the movements of the cards, according to the current peg positions on that board:

Conclusion
This board, which I have already been using for a while now, is very convenient for spaced repetition without the need of a computer. It is quite compact, in fact I have calculated that it could hold no less than 5000 cards. Of course, other boards can be printed if this is not sufficient! It still needs to get a decent cover so that it could be easily transportable.
The board is available to print on Thingiverse: https://www.thingiverse.com/thing:3974248
It is also available on my gitlab: https://gitlab.com/jytou/3d-paper-spaced-repetition
I have also written a converter to print your anki decks: https://gitlab.com/jytou/anki2papergenerator