Après plus de 10 ans sur Bépo en français et plus de vingt ans sur Dvorak en anglais, j’ai finalement décidé de basculer sur une nouvelle disposition de clavier : Optimot. Je ferai une entrée de blog complète plus tard, pour l’instant, je partage juste les bases de la disposition sur TypeMatrix :
Je suis en train de changer ma manière d’interagir avec les ordinateurs… tant en terme de souris que de clavier. Cela fera probablement l’objet d’autres posts, mais pour l’instant je poste juste la disposition bépo sur un clavier Typematrix (y compris les touches mortes, qui permettent au final de taper dans n’importe quelle langue utilisant une base latine), au cas où cela intéresse quelqu’un d’autre que moi.
Il y a des choses qui me déplaisent avec cette disposition, comme le simple fait que taper en anglais soit assez fastidieux (avec par exemple le placement du w et du h qui rendent les mots courants comme what, which… vraiment difficiles), et je prévois de tester prochainement l’Optimot qui est lui-aussi optimisé pour le français mais est moins pénible en anglais… à suivre.
As I’m switching to new input devices (mouse / trackball, keyboard), I’ll also make a change in the keyboard layout as I’ll switch to a split keyboard (I was using a hybrid of Dvorak / Bépo / Colemak until now on TypeMatrix – great keyboard by the way!), which will probably take some adapting, but it will be worth it on the long run.
For the record, I’m posting here the Bépo layout on a TypeMatrix keyboard, including dead keys (in red).
When installing software from non-official repositories in Debian-based distributions, you might come across “key problems”, such as:
The following signatures couldn't be verified because the public key is not available: NO_PUBKEY <key>
When it appears, you might scratch your head for quite some time.
There is a simple way of dealing with those. However, as I recently experienced while upgrading a machine, most tutorials are incomplete or even sometimes totally misleading.
Why keys?
First, let’s see what these keys are for.
When installing software from non-official repositories, Linux needs to download packages from those external sources. However, hackers may introduce malware inside the files that are on the servers of those external sources. This type of hack is not an easy one, since web administrators are watching those sites closely. However, when it succeeds, the attackers can automatically distribute their malware to a lot of computers at once. Consequently, everything should be put in place to avoid spreading Trojan horses this way.
This is why any file that can be downloaded is signed digitally by the actual provider of the source. If a hacker alters a file, the digital signature no longer matches the content of the file anymore. This way, your Linux distribution makes sure that anything it downloads is an unaltered original file as originally published by the source.
To verify the signature, it only needs the public key of the source. And that is why your distribution needs to keep a list of public keys of all the non-official sources.
The apt-key way (deprecated in Ubuntu 22)
Previously, one could import keys using a tool called “apt-key”. Such way is still generally mentioned in many tutorials, in the form:
Ubuntu and other distributions are switching to a different, more secure way of storing keys – although actually still not secure, but it is what it is.
Keys are now stored with GPG. To transition, it is possible to import keys from apt-key to gpg. This is done in two steps:
listing the existing keys with “apt-key list”, which gives the following type of result:
Note the “signed-by” part of the command, which specifically points to the following gpg file:
/usr/share/keyrings/docker-archive-keyring.gpg
So that’s exactly where your gpg file should be. The confusing part is that some tutorials / recommendations prefer /etc/apt/keyrings while others use /usr/share/keyrings.
Once your gpg key is in the correct place, your problem is solved.
I hope this will help prevent some of you from scratching your heads over this.
There are more and more reports about shortages in the supply of electronic components during the past year. What are the causes and should we be concerned? Will it lead to increased prices and will it last?
Let’s review the causes and what we can make of it.
Rising demand
The demand in electronics has been constantly rising for the last decades. One example is the demand for batteries, which is quite telling:
Obviously, this means that the supply chain has to grow accordingly, which is not always a given. And electronics are not the only ones suffering from supply chain problems: plastics are also in a strange condition right now.
The “work from home” drill
One of the first reasons for the shortage is a higher demand from consumers. With the pandemic and everyone switching to remote working last year, people had to buy extra computers (at least one for every member of the family) or upgrade existing ones (think about a better camera, a better processor or graphics card to deal with the video live streams, a larger screen on your desk at home since it has become your semi-permanent office, etc.).
This sudden demand created a spike in an already congested industry, hence a shortage. The problem is that such a spike should be only temporary, but it looks like the situation is not going to be resolved anytime soon. What is going on?
Toilet Paper
Remember the toilet paper shortages? Well, that’s pretty much what is happening with the electronics industry right now. Because people started being aware of the shortage and the potential for it to become long term, they have acted exactly as they did with toilet paper. Buy more. As soon as possible. Before it is too late.
So the initial hit on the demand is also worsened by panic buying. Of course, buying an extra computer is not as easy for many people as buying toilet paper, due to the price difference. So while the effect is felt within days for toilet paper, the time frame is counted in months for electronics.
The car industry
The car industry is one of the most demanding in terms of electronics: our cars are getting stuffed more and more with those chips and gadgets, and it is getting to a point where the car industry is hit very badly by the shortage. It is currently causing very heavy losses in sales in that sector. Back to the first chart of this post above, we can see that batteries for electric-powered vehicles is mainly responsible for the demand to jump almost exponentially. Any shortage in those immediately results in slower production.
Accumulation of incidents
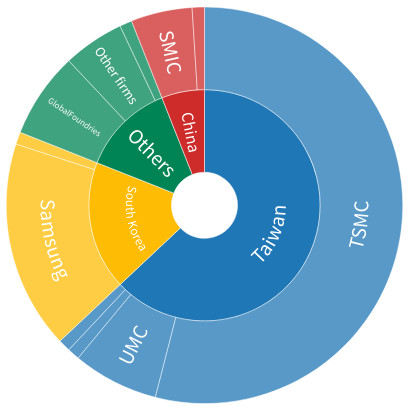
There have also been two major fires in the industry (one in Japan, another one in Taiwan), which have worsened the shortage, especially for memory chips.
In an already tense supply chain, any extra incident can bring a system to its knees. And the recovery is difficult since the supply was already not sufficient.
Note that the whole world depends on Taiwan for the supply of chips, which doesn’t make it very resilient.
As I warned a year ago on my blog at the beginning of the pandemic, Covid also disrupts supply chains since productivity is impacted – when the industries don’t close altogether. People needing to stay at home at the first sign of illness, whereas before everyone was still going to work with a running nose. And of course, wearing masks, material needing disinfection, etc.
All this obviously slows down existing systems. And again, in a “just-in-time” production mode with rising demand, this can only cause shortages.
Raw material shortage
As we all know, our planet is not infinite. With such a growth in demand, there must mathematically be a point when this never-ending growing trend goes beyond the total resources of the planet.
Along with silicon, some rare metals are getting scarce, if not already at the point of exhaustion. Other metals and rare-earth elements will follow, without any doubt. There would be a lot to talk about on this topic, but I’m keeping it short for now. Recycling those rare metals is typically a very big challenge – some of them in electronic components can actually never be recycled since it would need going to the atomic level.
And the shortage for some metals is not so far away. Just look at “other industrial metals” in the following chart, there is a chance you’ll see the shortage of some of them in your lifetime. And what then?
The current shortage has many causes. Some of them may be temporary, but others will undoubtedly be felt on the long term. Hopefully, as the price of the rarest materials increase, alternative technological solutions will enable us to replace rare materials with more common ones. Or maybe we’ll find this missing Germanium or Palladium on the Moon or Mars…
The post title may be blunt. But I think after reading this article, you will never use the type “char” in Java ever again.
The origin of type “char”
At the beginning, everything was ASCII, and every character on a computer could be encoded with 7 bits. While this is fine for most English texts and can also suit most European languages if you strip the accents, it definitely has its limitations. So the extended character table came, bringing a full new range of characters to ASCII, including the infamous character 255, which looks like a space, but is not a space. And code pages were defining how to show any character between 128 and 255, to allow for different scripts and languages to be printed.
Then, Unicode brought this to a brand new level by encoding characters on… 16 bits. This is about the time when Java came out in the mid-1990s. Thus, Java designers made the decision to encode Strings with characters encoded on 16 bits. All Java char has always been and is still encoded with 16 bits.
However, when integrating large numbers of characters, especially ideograms, the Unicode team understood 16 bits were not enough. So they added more bits and notified everyone: “starting now, we can encode a character with more than 16 bits”.
In order not to break compatibility with older programs, Java chars remained encoded with 16 bits. Instead of seeing a “char” as a single Unicode character, Java designers thought it best to keep the 16 bits encoding. They thus had to introduce the new concepts from Unicode, such as “surrogate” chars to indicate that one specific char is actually not a character, but an “extra thing”, such as an accent, which can be added to a character.
Character variations
In fact, some characters can be thought of in different ways. For instance, the letter “ç” can be considered:
either as a full character on its own, this was the initial stance of Unicode,
either as the character “c” on which a cedilla “¸” is applied.
Both approaches have advantages and drawbacks. The first one is generally the one used in linguistics. Even double characters are considered “a character” in some languages, such as the double l “ll” in Spanish which is considered as a letter on its own, separate from the single letter “l”.
However, this approach is obviously very greedy with individual character unique numbers: you have to assign a number to every single possible variation of a character. For someone who is only familiar with English, this might seem like a moot point. However, Vietnamese, for instance, uses many variations of those appended “thingies”. The single letter “a”, can follow all those individual variations: aàáâãặẳẵằắăậẩẫầấạả. And this goes for all other vowels as well as some consonants. Of course, the same goes for capital letters. And this is only Vietnamese.
The second approach has good virtues when it comes to transliterating text into ASCII, for instance, since transliterating becomes a simple matter of eliminating diacritics. And of course, when typing on a keyboard, you cannot possibly have one key assigned to every single variation of every character, so the second approach is a must.
Special cases: ideograms
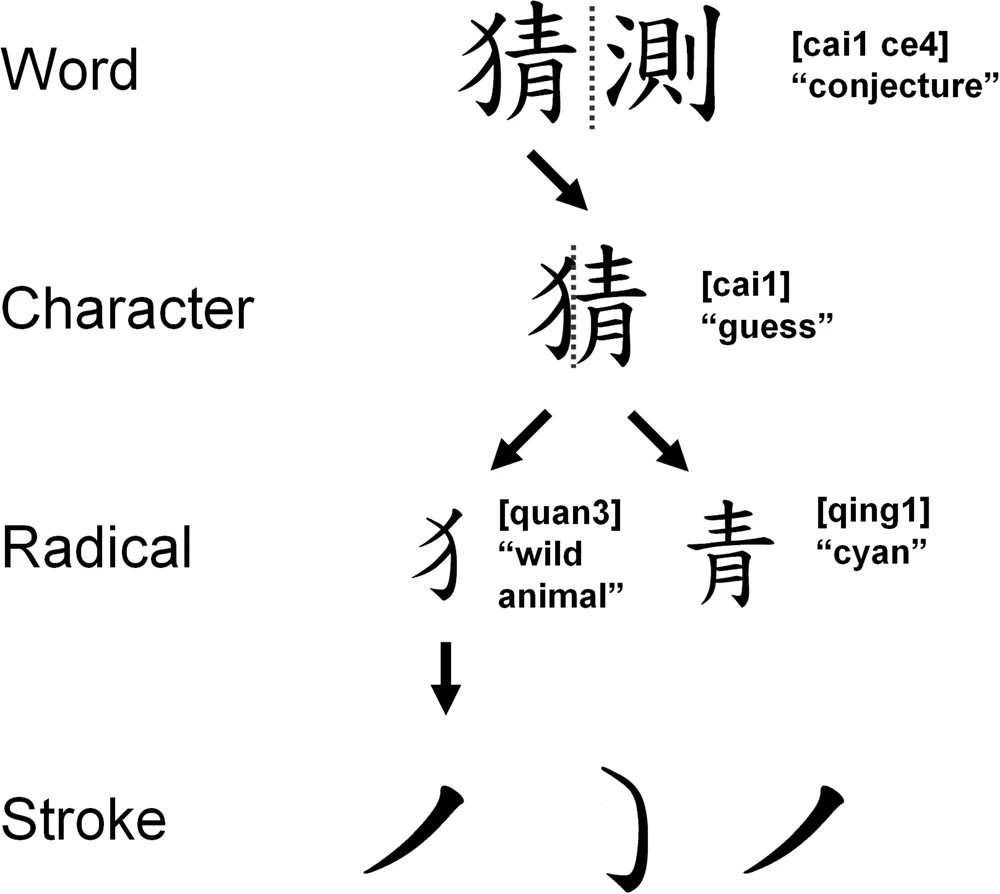
When considering ideograms, there are also a small number of “radicals” (roughly 200 for Chinese). Those get combined together to form the large number of ideograms we know (tens of thousands).
A Chinese Word’s decomposition (credit: Nature: https://www.nature.com/articles/s41598-017-15536-w)
It would be feasible to represent any Chinese character using a representation using radicals and their position. However, it is more compact to list all possible Chinese characters and assign a number to each of them, which is what was done by Unicode.
Korean Hangul
Another interesting case is Hangul, which is used to write Korean. Every character is actually a combination of letters and represents a syllable:
So, in some cases, it is easier to assign a number to every individual components and then combine them (which happens when typing in Korean on a keyboard). There are only 24 letters (14 vowels and 10 consonants). However, the number of combinations to form a syllable is very large: it amounts to more than 11 000, although only about 3 000 of them produce correct Korean syllables.
Funny characters
People, especially in social media, use an increasing number of special characters, emojis, and other funny stuff, from 𝄞 to 🐻. Those have made it into Unicode, thus making it possible to write ʇxǝʇ uʍop ǝpısdn, 𝔤𝔬𝔱𝔥𝔦𝔠 𝔱𝔢𝔵𝔱, or even u̳n̳d̳e̳r̳l̳i̳n̳e̳d̳ ̳t̳e̳x̳t̳ without the need for formatting or special fonts (all the above are written without special fonts or images, those are standard Unicode characters). Every flag of the world’s countries have even made it as a single character into the Unicode norm.
This plethora of new characters which made it late into the standard are often using more than 16 bits for their encoding.
Using type “char” in Java
When using the type “char” in Java, you accept that things like diacritics or non existent characters will be thrown at you, because remember, a char is encoded with 16 bits. So, when doing “𝄞”.toCharArray() or iterating through this String’s chars, Java will throw at you two characters that don’t exist on their own:
\uD834
\uDD1E
Both those characters are illegal, and they only exist as a pair of characters.
Bottom line, when it comes to text, chars shouldn’t be used. Ever. In the end, as a Java developer, you have probably learned that, unless doing bit operations, you should never use String.getBytes(), and use chars instead. Well, with the new Unicode norms and the increasing use of characters above 0xFFFF, when it comes to Strings, using char is as bad as using byte.
Java type “char” will break your data
Consider this one:
System.out.println("𝄞1".indexOf("1"));
What do you think this prints? 1? Nope. It prints 2.
Here is one of the consequences of this. Try out the following code:
System.out.println("𝄞1".substring(1))
This prints the following, which might have surprised you before reading this blog post:
?1
But after reading this post, this makes sense. Sort of.
Because substring() is actually checking chars and not code points, we are actually cutting the String which is encoded this way:
\uD834 \uDD1E \u0031
\___________/ \____/
      𝄞          1
It is amazing that a technology such as Java hasn’t addressed the issue in a better way than this.
Unicode “code points”
Actually, it is a direct consequence of what was done at the Unicode level. If you tried to break down the character 𝄞 into 16 bits chunks, you wouldn’t get valid characters. But this character is correctly encoded with U+1D11E. This is called a “code point”, and every entry in the Unicode character set has its own code point.
The down side is that an individual character may have several code points.
Indeed, the character “á” can be either of these:
the Unicode letter “á” on its own, encoded with U+00E1,
the Unicode combination of the letter “a” and its diacritic “◌́”, which results in the combination of U+0061 and U+0301.
Java code points instead of char
A code point in Java is a simple “int”, which corresponds to the Unicode value assigned to the character.
So when dealing with text, you should never use “char”, but “code points” instead. Rather than
“a String”.toCharArray()
use
“a String”.codePoints()
Instead of iterating on chars, iterate on code points. Whenever you want to check for upper case characters, digits or anything else, never use the char-based methods of class Character or String. Always use the code point counterparts.
Note that this code will actually fail with some Unicode characters:
for (int i = 0 ; i < string.length() ; i++)
    if (Character.isUpperCase(string.charAt(i)))
        ... do something
This will iterate through characters that are NOT characters, but Unicode “code units” which are possibly… garbage.
Inserting data into a database
Consider a simple relational table to store unique characters:
Charac
id 🔑 (primary key)
int(11)
c (unique constraint)
varchar(4)
Now imagine your java program is inserting unique characters in the column “c” of this table. If based on “char” the Java program will consider two different surrogate chars as different since their code are different, but the database will store strange things at some point since those are not valid Unicode codes. And the unique constraint will kick in, crashing your program, and possibly allowing wrong Unicode codes to be pushed into the table.
Alternative replacements
String.toCharArray()
String.codePoints() (to which you can append toArray() to get an int[])
String.charAt(pos)
String.codePointAt(pos)
String.indexOf(int/char)
String.indexOf(String)
iterate with String.length()
convert String into an int[] of code points and iterate on those
String.substring()
Make sure you don’t cut between a surrogate pair. Or use int[] of code points altogether.
replace(char, char)
replaceAll(String, String) and other replace methods using Strings
new String(char[]) new String(char[], offset, count) String.valueOf(char[])
new String(int[] codePoints, int offset, int count) with code points
Edit au 28/09/2021 : ajout des vues ajustées par tranches de population.
Introduction
La transparence est essentielle pour construire une société de confiance. Étant moi-même toujours en doute avec les informations que je rencontre, quelle que soit leur source, je me suis posé beaucoup de questions sur la mortalité depuis le début de l’épidémie de Covid. J’ai d’ailleurs posté des compte-rendus détaillés (et moins détaillés) de ce que je trouvais sur la Covid, ainsi que d’autres informations ici, là, et là et ailleurs.
L’un des principaux problèmes qu’un citoyen lambda rencontre très vite, c’est la difficulté à évaluer des données nationales qui sont par définition des agrégats, parfois des agrégats d’agrégats… sachant que tout le monde y va de ses propres interprétations. Il me fallait donc repartir de données brutes difficilement falsifiables ou manipulables.
Quelles données ?
Par ailleurs, la comptabilisation des « morts Covid » est toujours biaisée, car comme je l’indique dans cet autre billet, on meurt le plus souvent d’une multitude de facteurs, pas seulement de la Covid (ou d’une autre maladie).
Il ne nous reste donc plus, à nous autres citoyens lambda, la mortalité « toutes causes », qui représente une réalité non biaisée : telle personne est morte à telle endroit à telle date. Or, l’INSEE fournit exactement ces données détaillées. Les données ont toujours 1 mois et demi à 2 mois de retard. Cela permet tout de même de regarder rétrospectivement ce qui s’est passé pour pouvoir anticiper ce qui va arriver. Mais surtout, cela permet de juger du degré de fiabilité de diverses sources d’informations lors des événements passés, et ainsi de se construire un indice de confiance sur telle ou telle source.
J’ai donc développé un programme pour analyser ces données et calculer des courbes de mortalité à partir de ces données brutes. J’ai également mis en place un site pour afficher les résultats, que vous pouvez consulter là (le site est chez moi, il est donc possible qu’il ne soit pas toujours disponible et qu’il donne une vue erronée au moment où je fais des mises à jour des données, une fois par mois).
Petit manuel de l’utilisateur
Quelques petites remarques sur le site :
les données proviennent directement des données brutes, filtrées (car il y a des doublons dans les fichiers de l’INSEE),
le graphe correspond à une année entière, donc les données les plus à gauche correspondent au début de l’année, et celles les plus à droite à la fin de l’année,
les différents types d’affichage sont :
absolu : c’est le nombre de morts chaque jour,
pondéré : le nombre de morts pour 1 million d’habitants, ce qui permet de comparer d’une année sur l’autre puisque la population varie d’une année sur l’autre,
étalé : c’est la moyenne glissante du nombre de morts pour 1 million d’habitants sur 10 jours, cela permet d’avoir une version « lissée » des courbes,
pondéré 70+ et étalé 70+ : mêmes vues que les précédentes, mais au lieu de pondérer par la population par année, ces vues sont pondérées par la mortalité moyenne de la population en fonction des tranches d’âges vivantes de l’année en cours, que l’on peut récupérer par exemple ici sur le site de l’INSEE.
on peut filtrer par département (ou par pays étranger) pour observer la mortalité dans une région donnée et ainsi cibler des événements locaux,
on peut également filtrer par tranches d’âges pour voir l’impact des événements en fonction des âges,
on peut filtrer avec un intervalle d’années et/ou de mois, afin de pouvoir comparer des années proches sans le « bruit » des autres années,
lorsqu’une seule année est sélectionnée (filtrage de l’année x vers la même année x), l’affichage bascule automatiquement en mortalité par tranche d’âges, pour analyser un événement en particulier de cette année-là, par exemple.
Transparence
Dans un souci de transparence et pour faire marcher l’intelligence collective, je publie les sources de mes programmes en open source. Ainsi, chacun peut vérifier mon code, et même l’installer chez soi, le modifier, l’améliorer, et se faire sa propre opinion en toute indépendance.
This week-end’s project was focused around building a simple indicator on my desk that alerts me of any problem at home in real time. That way, I don’t need to regularly check things around. Well, this may sound overkill for many people. But over the years, I’ve written a program to monitor many things around me without the need to perform a regular check myself. The only thing I was missing was some real-time indicator that would alert me whenever something urgently needed my attention.
Computers. I am a computer engineer, and as such I do have a few electronic equipment around. I also monitor the temperature, humidity in and out of the apartment and also water leaks with sensors, as I have some sensitive musical instruments in my home. In the past 2 months, the temperatures here have gone up to 37 degrees Celsius several times. These measurements have helped us, without air conditioning (any form of heat pump makes things worse for the environment on the long term), to mitigate the heat. We could close everything when outside was hotter than inside, and open in the evening when the temperatures outside were coming close to the temperature inside.
Here are the temperatures my system measured for the last 5 days:
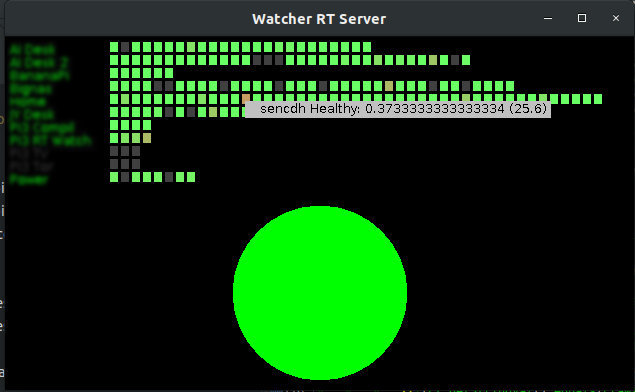
Where I came from
I already had a raspberry pi set up with a tiny monitor showing all the indicators and a big green light (or orange or red) showing the overall status. Something like this:
But this screen consumes 2.5 Watts when it is on, and only 0.15 Watt when it is off. This is a substantial difference, not even mentioning how much wear it causes the screen to be constantly on, just to show a green light!
The solution
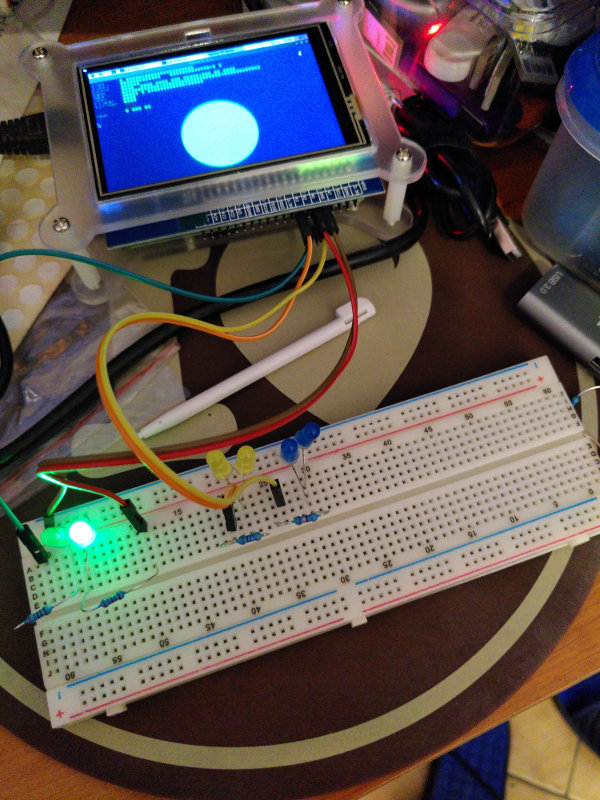
A simple solution: use simple LEDs (which consume virtually nothing) controlled by the raspberry. So I built a first circuit to test the whole thing out:
Of course, that also works with the screen off, that’s the goal after all!
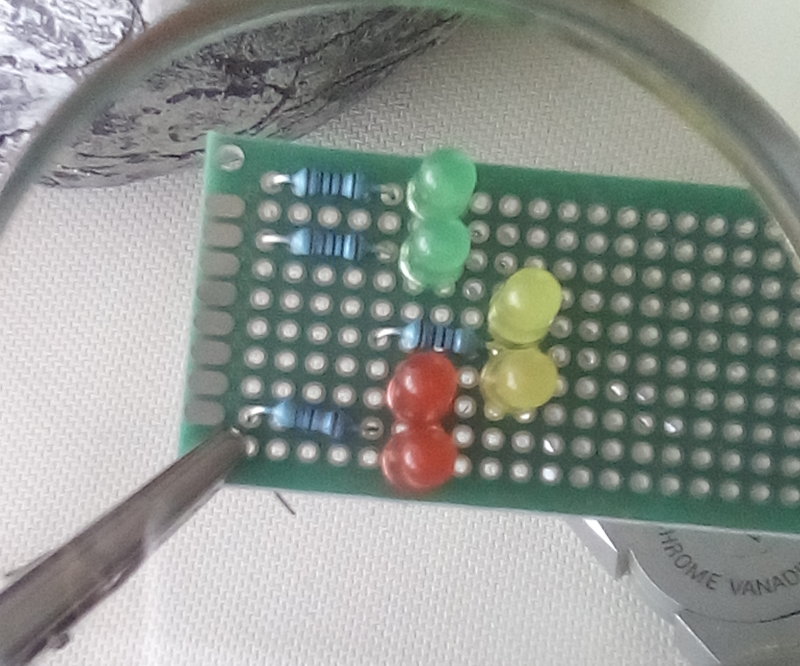
A printed circuit
I had to arrange things together on a smaller plate:
… and solder the whole thing together (yes I butchered the soldering, sorry):
That was a mess…
Buddha (you can see his legs on top of the picture) had a hard time coping with the mess, but he played his role perfectly and went into a deep meditation:
And of course I then had to use this very useful piece of equipment for the cables:
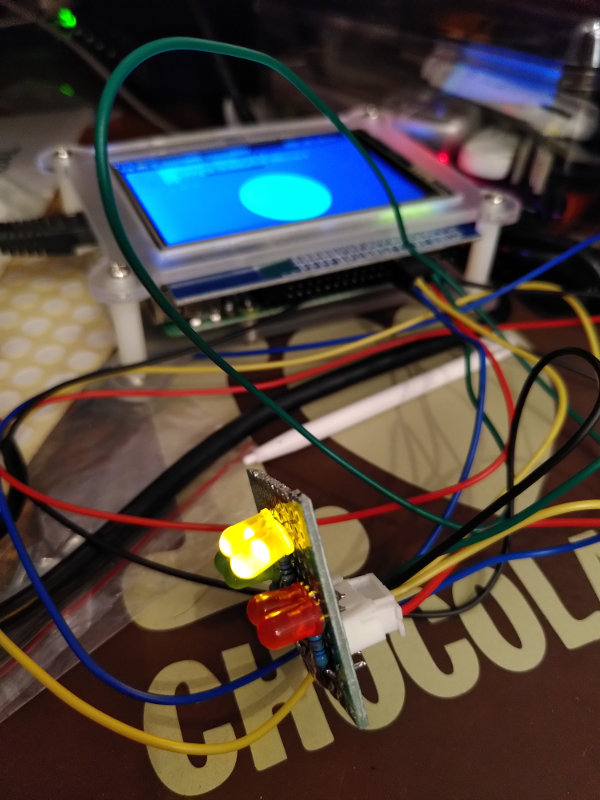
Trying it out
The first testing worked out as expected.
I just needed to print a little box for it with the 3D printer:
Final words…
You might wonder why there are two alternating green lights. Actually, using a single green LED was not an option. If it was constantly on and green, then I wouldn’t be able to know if the program that controls the indicator is still running… or if it has crashed. Of course, I could make one single LED blink… but any blinking inevitably catches the eye and is bothering. On the other hand, two alternating green lights don’t catch the eye because the overall luminosity is constant, while ensuring that the program is alive.
Of course, the error state with a red light and the warning state with an orange light are blinking to make sure that my eye will instantly see it:
You might have noticed that I also have doubled those, this time it is a simple redundancy in case one of the LEDs fail (which is not very likely any time soon given how robust those LEDs are). Besides, I found the luminosity of a single LED a little bit weak, so I preferred having two LEDs with a stronger resistance and thus less strain on each individual LED.
And now I have an indicator on my desk telling me at all times that everything is ok. Or not.
Deuxième vidéo d’une série sur la blockchain. Si vous avez entendu parler de cette technologie mais que vous vous posez des tas de questions, cette série est faite pour vous !
Après avoir donné un rapide historique et les divers usages de cette technologie dans la première vidéo, on s’attaque cette fois à ce que c’est un peu plus en détail sans pour autant virer dans la technique.
Visible aussi sur youtube : https://youtu.be/Zhvq0wE8F3Q
I’ve just unmounted my drives from my Synology box, replaced by a home-brewed server. I’ll write some other article about the reasons that made me switch. Just in case you wonder, the Synology box is running fine. That’s not the point.
I took the disks from the Synology box and plugged them into a host with simple Linux distrib (in my case, Ubuntu, but that shouldn’t matter).
Just type:
mount /dev/vg1000/lv /mnt
That’s it. You have the file system from your Synology box on your Linux machine. It may come handy in case your box crashed and you are waiting for a new one. In the meantime, you have access to your data.
In case you want to reuse the disks and dispose of them (WARNING: the following will destroy your data on those disks), here is how to do it.
vgremove vg1000
Now check the md volumes that are available and that you didn’t create yourself (just use ls /dev/md12*). Then stop those volumes (replace md12? with the volumes you want to stop if you have additional ones on your system that you obviously don’t want to stop – they won’t stop if they are mounted anyway):
mdadm -S /dev/md12?
Empty the beginning of the related disks, for each disk replace the … by your disk letter:
dd if=/dev/zero of=/dev/sd… bs=1M count=1024
And now you can play around with partitioning etc without being bothered again by vg1000 or mdadm.