
Welcome to the second part of my version of the Yolland Bresson Module, started in Part 1.
(d) Exchanging values during 50 years in a Libre currency
In this part, we’ll see what happens when individuals do some exchanges, since it is actually what money is here for! So we’ll have generations of 10 people which replace each other over time and watch the impacts on the accounts of these exchanges over time.
Simple exchanges
To begin with, the sample given in the Module is to have exchanges at 5, 15 and 30 years. Besides, in my sample, I’ve given a very unfair distribution to my individuals with the oldest having a lot of money while the youngest has 0. I also chose to use the relative scale for the exchanges so that we can actually compare the relative amounts which don’t change over time, with an average of 10 UDs for all individuals. Finally, the amounts that are exchanged are quite big, making the individuals’ accounts switch from “rich” to “poor” and vice-versa at every exchange:
| Year | I1 | I4 | I5 | I7 | I11 |
| 5 | -10 UD | 10 UD | |||
| 15 | -8 UD | 8 UD | |||
| 30 | -10 UD | 10 UD |
Just for the record, this corresponds in the absolute scale to the following exchanges:
| Year | I1 | I4 | I5 | I7 | I11 |
| 5 | -72.47 | 72.47 | |||
| 15 | -150.4 | 150.4 | |||
| 30 | -785.2 | 785.2 |
As expected, the same amounts in UD correspond to exponentially growing numbers in the absolute scale.
Visualizing the impacts of simple exchanges
Unfortunately, the absolute graph doesn’t show anything because of the exponential curve, so we’ll directly switch to the log view:
 While we do see the exchanges, they seem to have extremely little impact on the overall curves. Consequently, let’s switch to the relative scale:
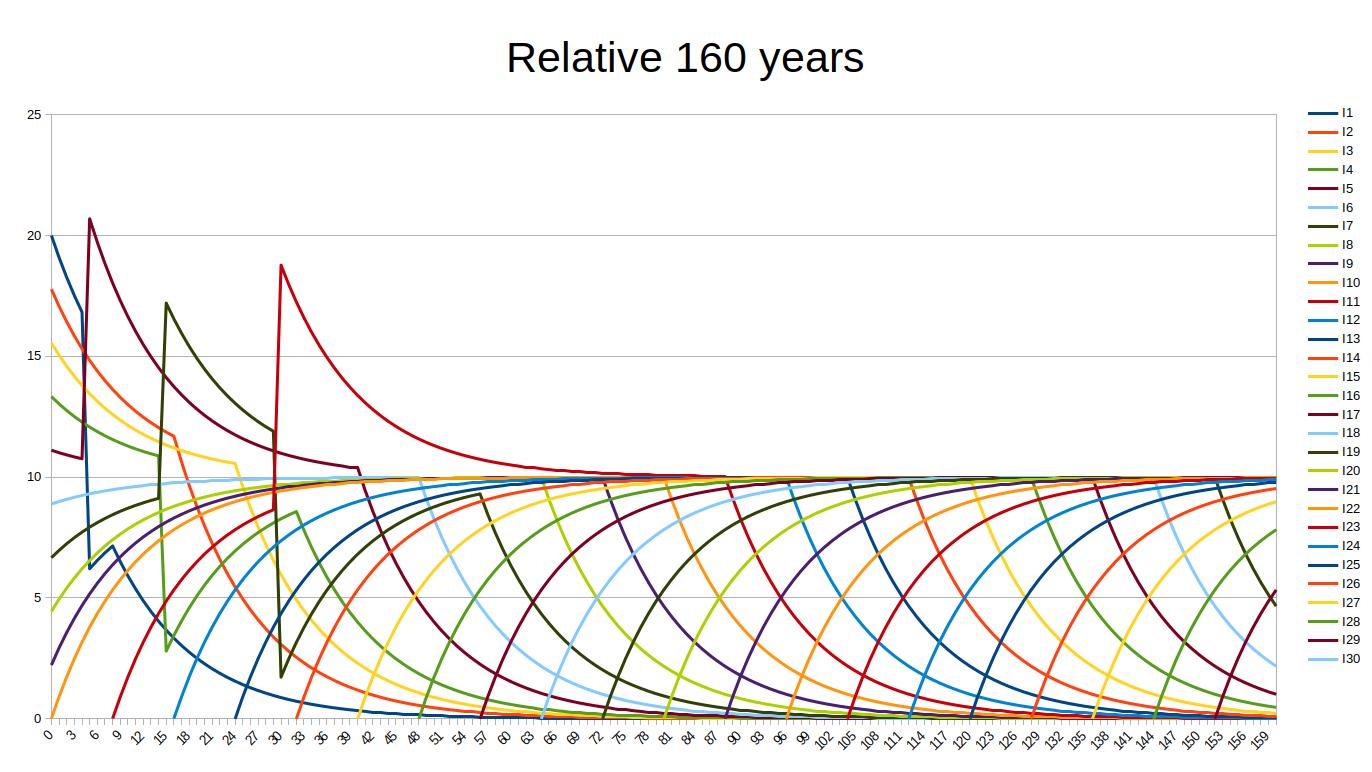
What happened is pretty obvious now: although they have exchanged very big amounts of money, in the end the result is that when they die their accounts converge toward 0 and new generations (after a few decades) are not impacted by what has been done by the previous generations. Therefore, these new generations can choose their own path and their own values, regardless of what their parents have done and valued.
Focusing on one individual
We can also have a look at the account of one of them only, for instance I7 who has done two transactions:
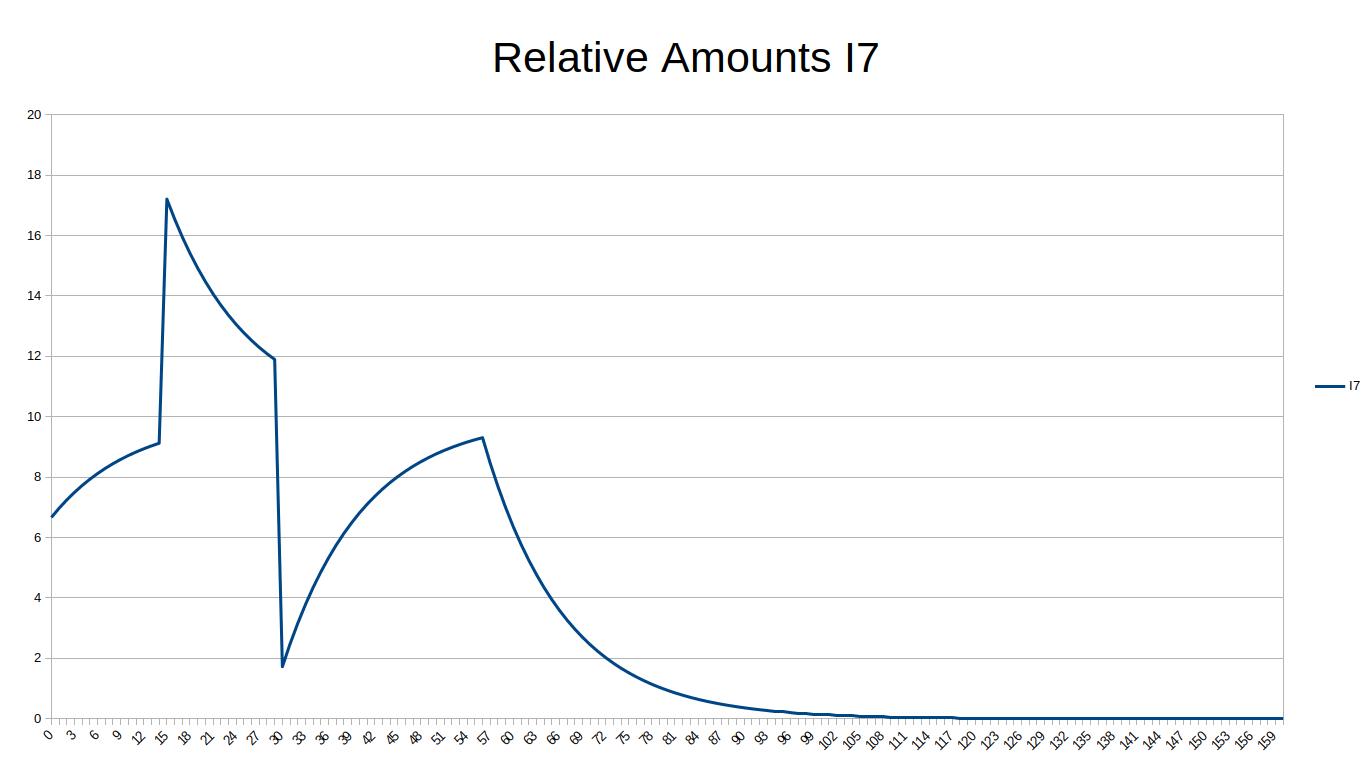
Obviously, because he has gained quite a bit at year 15, his account has inevitably decreased in relative terms after that compared to other accounts so that all of them reach the mean of all accounts. But then as he becomes “poor” at year 30, his account starts tending toward the mean again, this time by “growing”. And of course, as death takes him away, his account tends toward 0, as everyone else (except for vampires of course).
Double accounting
Until now, we have only considered transactions between humans, who generally exchange money to compensate another exchange in real life: buying some object or service. However, we could express that in a “double-entry” table for each individual where we don’t consider only monetary exchanges:
| Year | I1 – Credit | I1 – Debit |
| 5 | +motorcycle | -10 UD |
With that in mind, we can actually fill the previous table with the double accounting for each event and each individual:
| Year | I1 | I4 | I5 | I7 | I11 |
| 5 | -10 UD +motorcycle |
10 UD -motorcycle |
|||
| 15 | -8 UD +boat |
8 UD -boat |
|||
| 30 | -10 UD received coaching |
10 UD spent time coaching |
Obviously, every monetary exchange has its own counterpart in the “real world”, either by transferring the property of something from someone to someone else, either by giving one’s time/expertise/work, whatever you call it, to someone else.
Double accounting – including the UD
In the meantime, there is really something missing in this table. In the balance of every individual’s account, a Universal Dividend is created every year. For everyone of them. So if we forget about their exchanges, the balance sheet is somehow missing something:
| Year | I1 | I4 | I5 | I7 | I11 |
| 5 | +1 UD | +1 UD | +1 UD | +1 UD | +1 UD |
| 15 | +1 UD | +1 UD | +1 UD | +1 UD | +1 UD |
| 30 | +1 UD | +1 UD | +1 UD | +1 UD | +1 UD |
Think about it, isn’t there something missing? We have UDs that are added, but nothing is subtracted to make the sheet balanced.
| Year | I1 – Credit | I1 – Debit |
| 5 | +1 UD | ??? |
Or is it really so?
The counterpart of the UD
Well, it isn’t. Every one of us is alive and is somehow always doing “something”. During our life, we give our time and energy to things that are meaningful to us. In addition, sometimes without even noticing it we create value in society, even in the smallest acts of our lives.
For instance, say you watched a football match yesterday while drinking beer and eating junk food. That doesn’t seem much of a contribution to society. I actually don’t like football, if you ask me, you’ve wasted your evening, and wasted yourself with the alcohol as well!… 😀 the fact is that my opinion here is not relevant since here we’re interested about you.
Due to the match you watched, maybe the next day at work you’ll have a nice chat with your colleagues and somehow, with that simple chat and some jokes about the match, you’ll have created a relaxed atmosphere at work that will make everyone positive for the next few hours. Isn’t that a contribution after all? Frankly, do you really think that brightening the day of someone else is a waste of your time?
Furthermore, it gets even more interesting if you produce some “things” that are not recognized by your peers (or even by yourself!) but that may be recognized as great achievements in the future, such as Mozart’s compositions or Vincent van Gogh’s paintings. As we’ve already seen in the Galileo module, we can call these ğvalues. We may not all be geniuses, but we all make contributions that are not recognized today as full “values”, and which have the potential of becoming values in the future.
Furthermore, other people in another part of the Earth might also be interested in your creations because the cultural biases of another society will be able to recognize them as values, while the society you live in don’t recognize them as values – think for instance metaphysical, meditation-related discoveries that would be considered utter b**lshit in the West but greatly valued in the East.
Let’s fill the blanks
With that in mind, let’s get back to our table. We can now fill it with the appropriate negative accounts of your time that you spend being alive and contributing to society as a whole by focusing on your own values and creating ğvalues:
| Year | I1 | I4 | I5 | I7 | I11 |
| 5 | +1 UD -ğvalues |
+1 UD -ğvalues |
+1 UD -ğvalues |
+1 UD -ğvalues |
+1 UD -ğvalues |
| 15 | +1 UD -ğvalues |
+1 UD -ğvalues |
+1 UD -ğvalues |
+1 UD -ğvalues |
+1 UD -ğvalues |
| 30 | +1 UD -ğvalues |
+1 UD -ğvalues |
+1 UD -ğvalues |
+1 UD -ğvalues |
+1 UD -ğvalues |
Hurray, we do have a balanced double-accounting sheet now.
In conclusion, we have filled the double-entry table and everything is balanced now, thanks to the notion of ğvalue, which is the counterpart of the UD.
Multiplying exchanges
I have also played a little with more exchanges.
Here is the graph of many exchanges made by the exact same individuals:
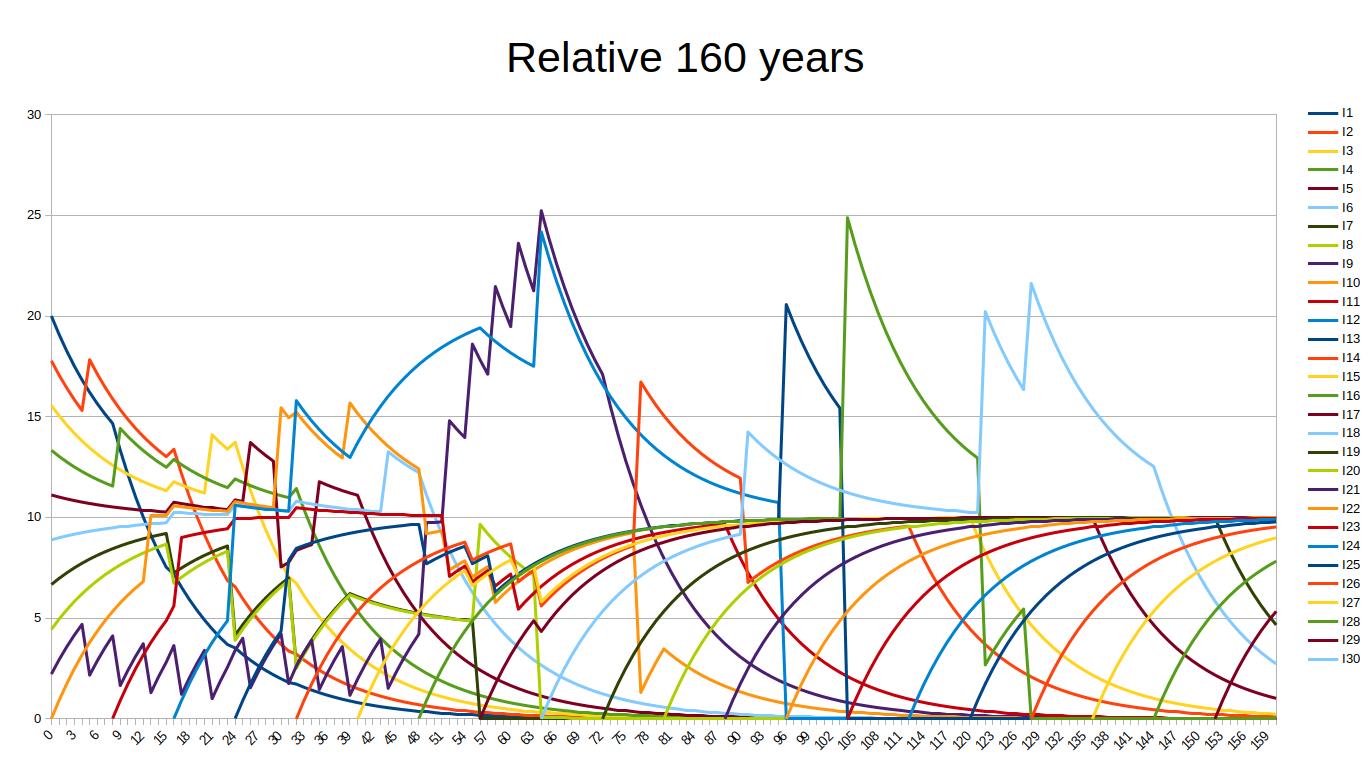
Ok, I’ll have to agree that it’s quite messy. However the first thing we can notice is that, although they did make a lot of very unbalanced exchanges, the conclusion is always the same: whatever they did, their accounts never became excessively high (up to 2.5 times the average of all accounts) and they always go back to 0 after their death.
Nevertheless, these exchanges are not random – let’s detail what happened here in more detail.
Hoarding “things”
There are many questions that arise about Libre Currencies. One of them is the fact that people would be tempted to get away from their money and buy “something” that would be a store of value for them (think “gold”, for instance). Then later, by selling those things back, they would have an advantage since they wouldn’t have lost their purchasing power, unlike storing libre units of value which statistically lose value exponentially in time.
I have simulated exactly that with one individual, I10. During the first part of his life, he systematically spends his money to buy things. After that, as he reaches his 59th birthday, he sells those things back. Note here that I have considered that the price of those “things” he bought have not changed in the relative scale. For instance, that could be true for something like gold, but you could also imagine many other things. I have isolated the graph for this individual and the people he exchanged with:
 It is apparent here that he seems to be “cheating” during the first part of his life. Obviously, he refuses to go to the mean of all accounts so his account gets always filled with money, while other people’s accounts get higher.
Conversely, toward the end of his life, by selling what he has been hoarding during his whole life, he suddenly becomes very rich compared to the others, while everyone else is getting poorer.
Thoughts on I10
Obviously, this technique could be used to “optimize” your account in Libre Currency. I have seen people do that during Ğeconomicus games. However, this technique did not seem to be as fruitful as it could appear at first sight. That is because as the person is “buying” things he is actually not using, he is depriving himself of a very important tool: money itself. In other words, instead of using money for what it is, a means of exchange, he is using it for hoarding things, therefore giving himself a penalty because he cannot exchange with money much anymore.
Furthermore, he takes a great risk. Who knows if the “things” he bought will be considered as having any “value” at all in 30 years when he plans to sell them back? Nobody can guarantee that. Therefore, he’s taking a big chance, and may find himself with no money in his account and be surrounded with useless objects that nobody wants to buy. Certainly, that was not a very smart move! Besides, he could be having problems if he bought a lot of similar things: as he is selling them back, their price will inevitably get lower.
Additionally, we can also wonder how much of those “things that are stores of value” he will be able to buy, as everyone else will also value those things as such. So there will inevitably be a balance to be found on the prices of those objects, while money is circulating around, which is exactly what it was invented for!
Finally, although I10 did manage to get richer somehow toward the end of his life, he did not get “insanely” rich. So such a scheme is not a huge problem overall as he has paid a strong penalty for the rest of his life.
Inheritance
Another interesting question is the one of inheritance. Therefore, I have simulated a family that would try to transmit its monetary riches to its descendance in the hopes of getting richer and richer, as it happens with today’s monetary system. Indeed, despite all inheritance taxes and efforts by the State to grab whatever it can, the rich manage to get richer, generation after generation.
Without further ado, here is the graph of the “inheritance scheme” family who pass on the wealth to the spouse then to the children when one of their member dies: Indeed, they do manage to get a little richer than the average, thanks to the inheritance. Let’s say maybe twice as rich on average. Undoubtedly, that’s absolutely ridiculous compared to the rich today who are millions of times richer than the average population. Besides, everyone else will probably do the same thing, so there is no inequality here. The main point here being that even if trying to pass on great wealth, nobody can get hundreds of times richer than the others.
(e) General interpretation on Relativity
As a conclusion, we have first seen that in a Libre Money system, everything has its own counterpart: the UD is balancing the ğvalues created by humans.
Besides, this balance ensures that no minority manages to tip the scale in their favor since everyone’s contribution is always pushing the global scale to be symmetrically balanced in space and in time as well.